- Published on
How I Got into Day Trading Options: A Mentor's Insight
- Authors

- Name
- Ang Yi Shuan
How I Got into Day Trading Options: A Mentor's Insight
As I reflect on my journey into day trading options, I can't help but attribute much of my initiation to the guidance of a seasoned mentor. Their expertise and the strategic way they introduced me to the world of options played a pivotal role in shaping my understanding and eventual passion for this dynamic form of trading.
(Spoiler alert: I do not manually day trade anymore after learning about systematic trading. I leave it to my algotrading system TailTitanPro where it's completely automated.)
The Eye-Opening Introduction
It all began with a series of meticulously chosen option charts and real-life examples that my mentor presented to me back in 2021. One particular instance stands out vividly in my memory. I recall as they pulled up charts displaying the Open, High, Low, and Close (OHLC) prices, as well as bid/ask spreads for various option contracts.
Unveiling the Potential: Long Calls and Puts
Among the examples shared, several option contracts caught my attention, each highlighting the remarkable profit potential inherent in options trading. The following four examples are flagged out from my own options data analysis program, but my mentor shared with me similar examples when I just started out.
1. US.DOCU231215C57000
- Contract: $57 0DTE call option on DOCU (Docusign Inc)
- Expiry Date: December 15, 2023
- Entry: Bid/ask of 0.01/0.02 at 12:54 PM, December 15, 2023
- Exit: Bid/ask surged to 7.4/8.05 at 2:24 PM, December 15, 2023
- % Gain: Approximately 36900% gain in just 1.5 hours.
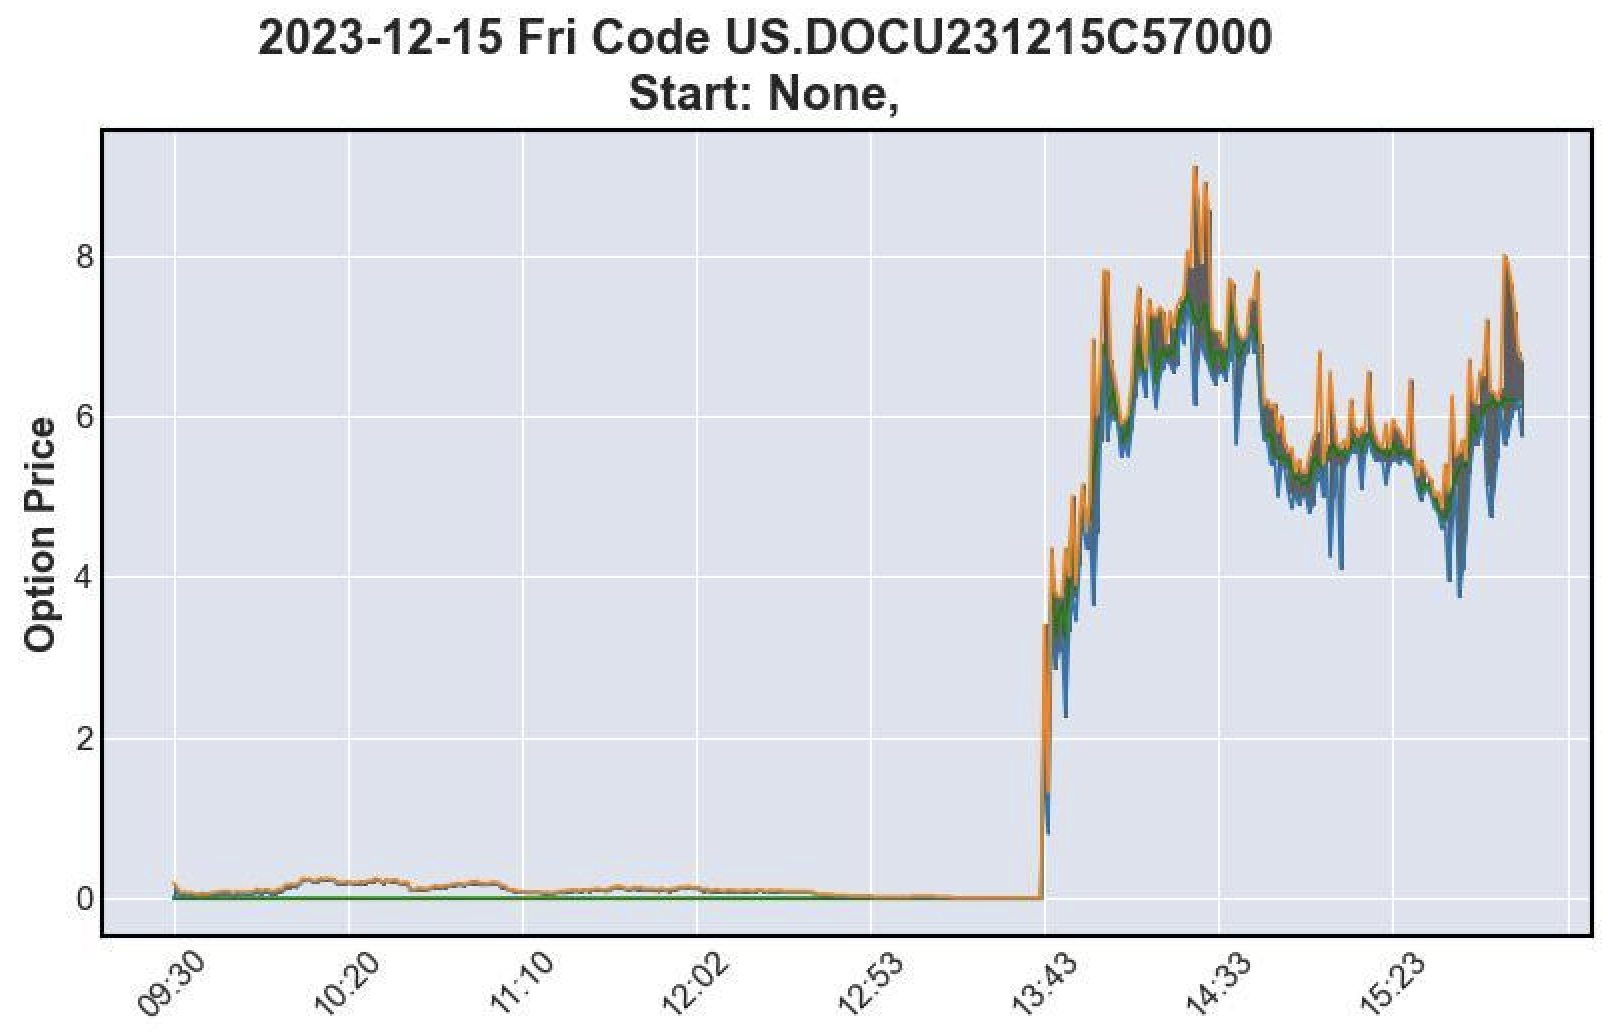
Bid/ask plot for US.DOCU231215C57000
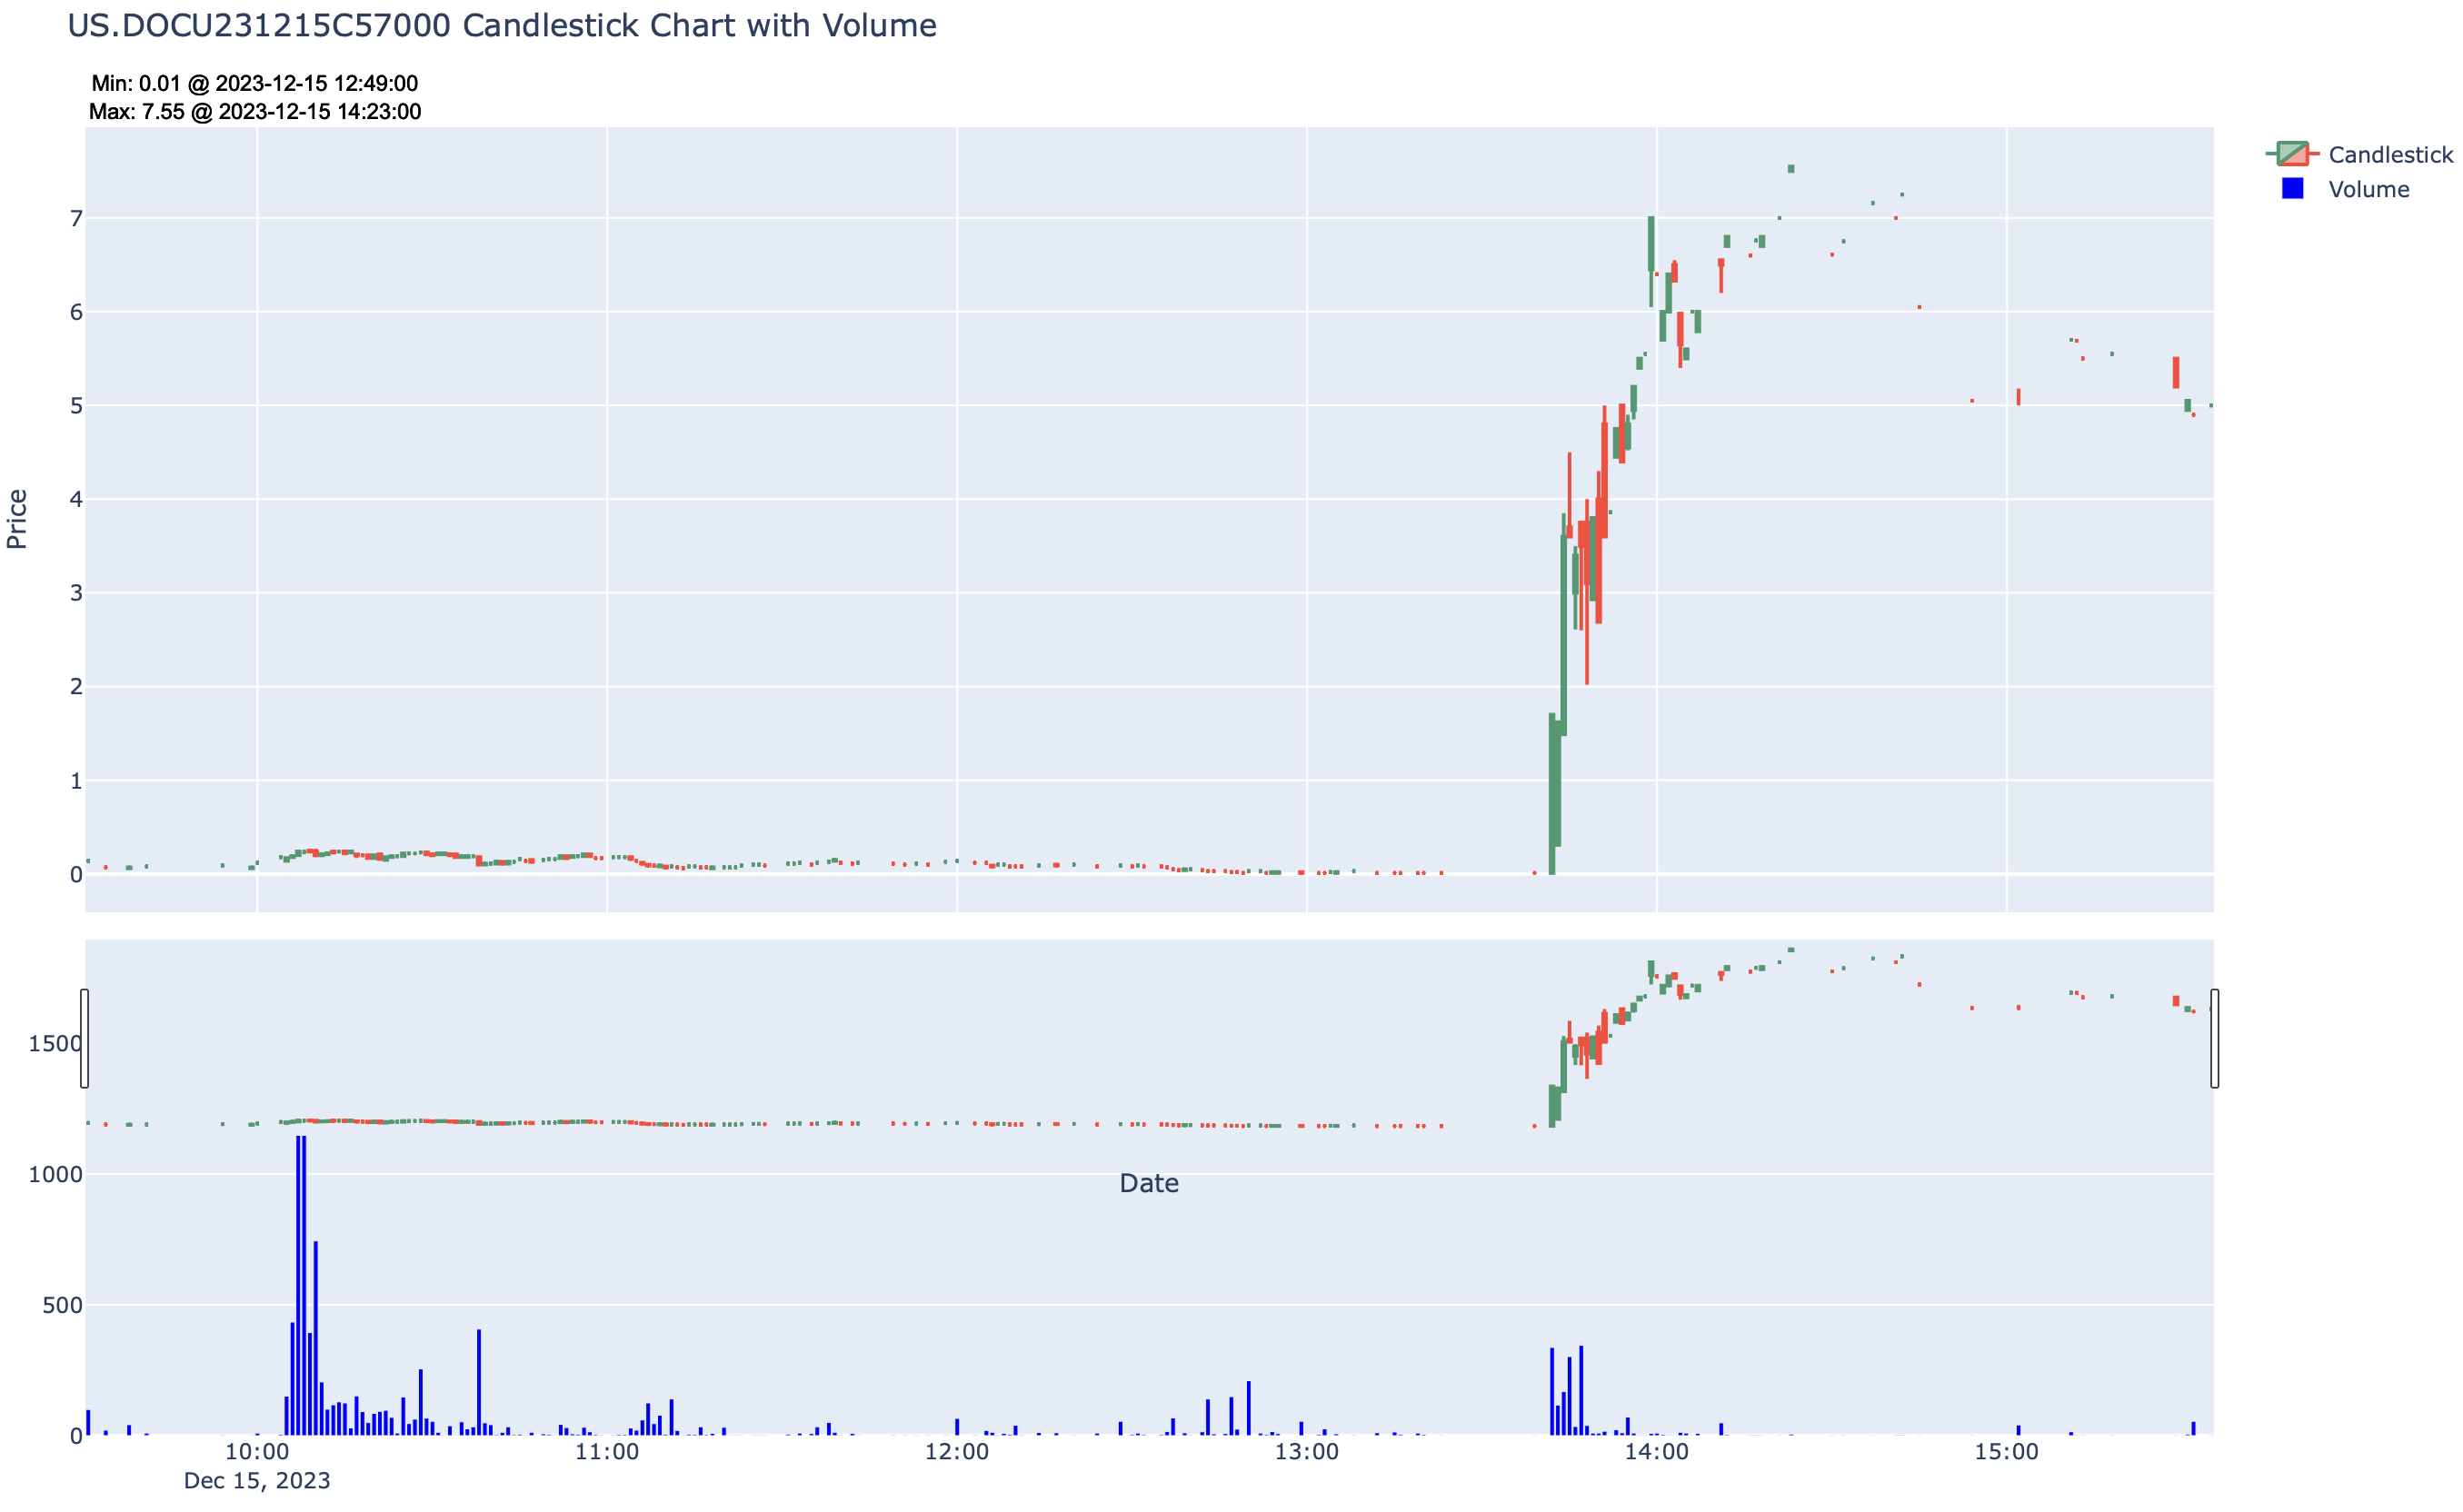
OHLC + volume 1-minute candlestick plot for US.DOCU231215C57000. Click on the image to open an interactive chart.
2. US.BA230825C217500
- Contract: $217.50 0DTE call option on BA (British Airways)
- Expiry Date: August 25, 2023
- Entry: Bid/ask of 0.01/0.02 at 11:58 AM, August 25, 2023
- Exit: Bid/ask surged to 4.8/5.05 at 2:31 PM, August 25, 2023
- % Gain: Approximately 23900% gain within 2 hours and 33 minutes.
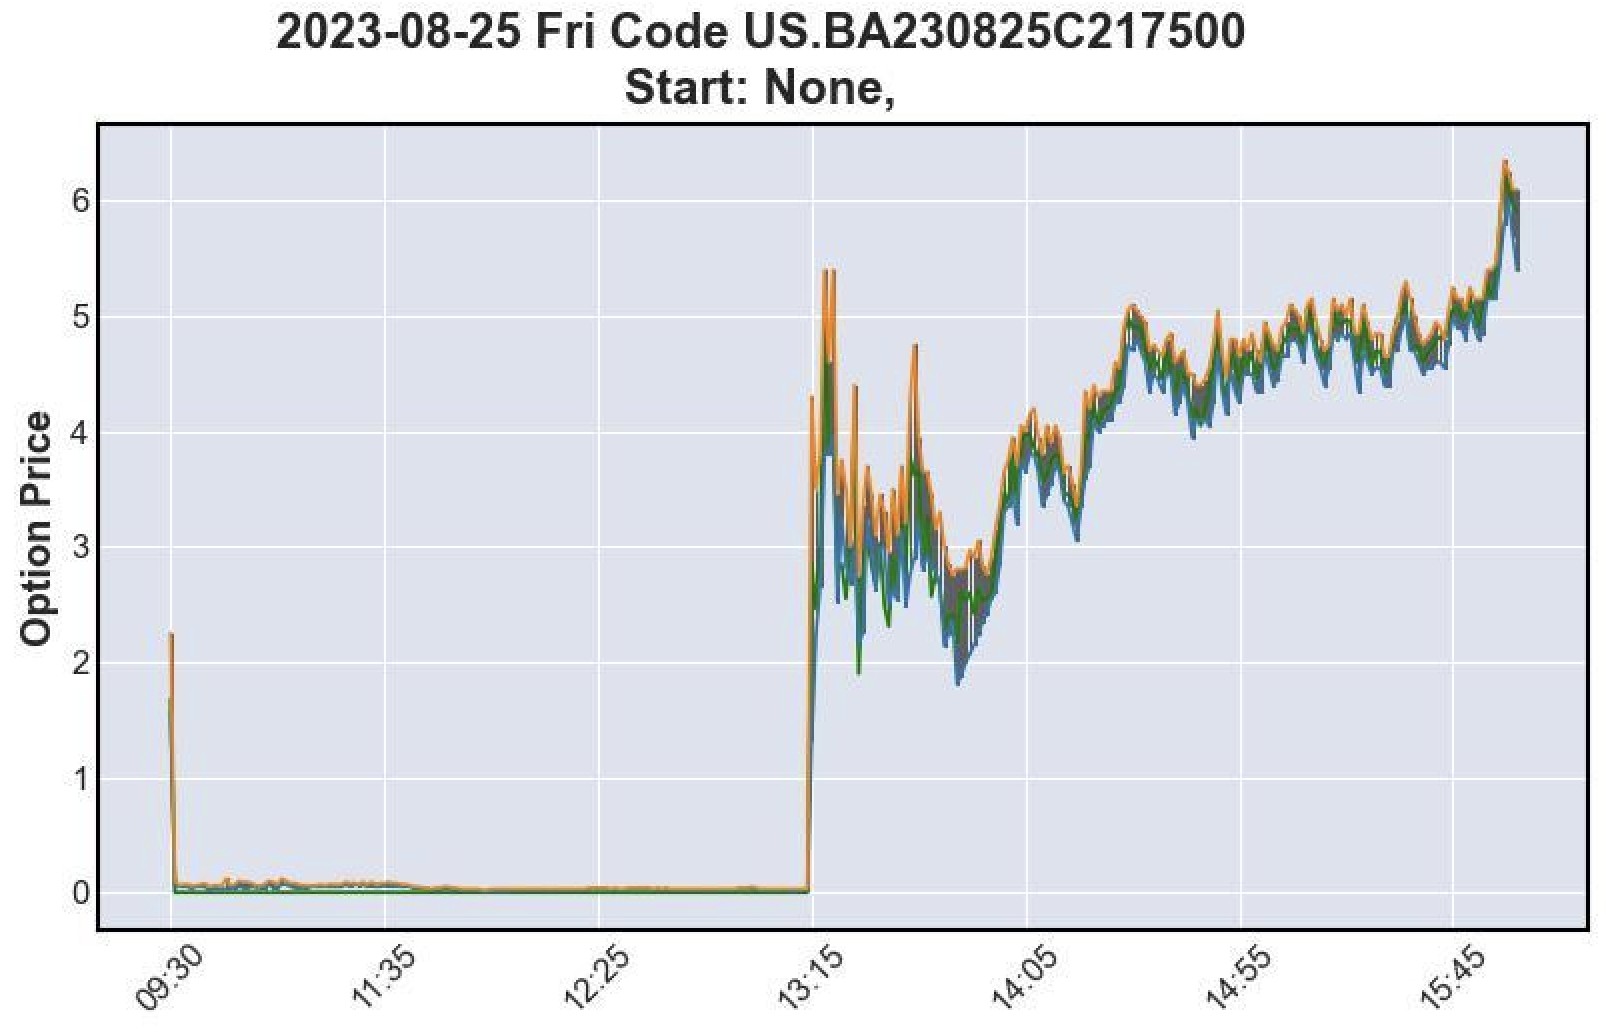
Bid/ask plot for US.BA230825C217500
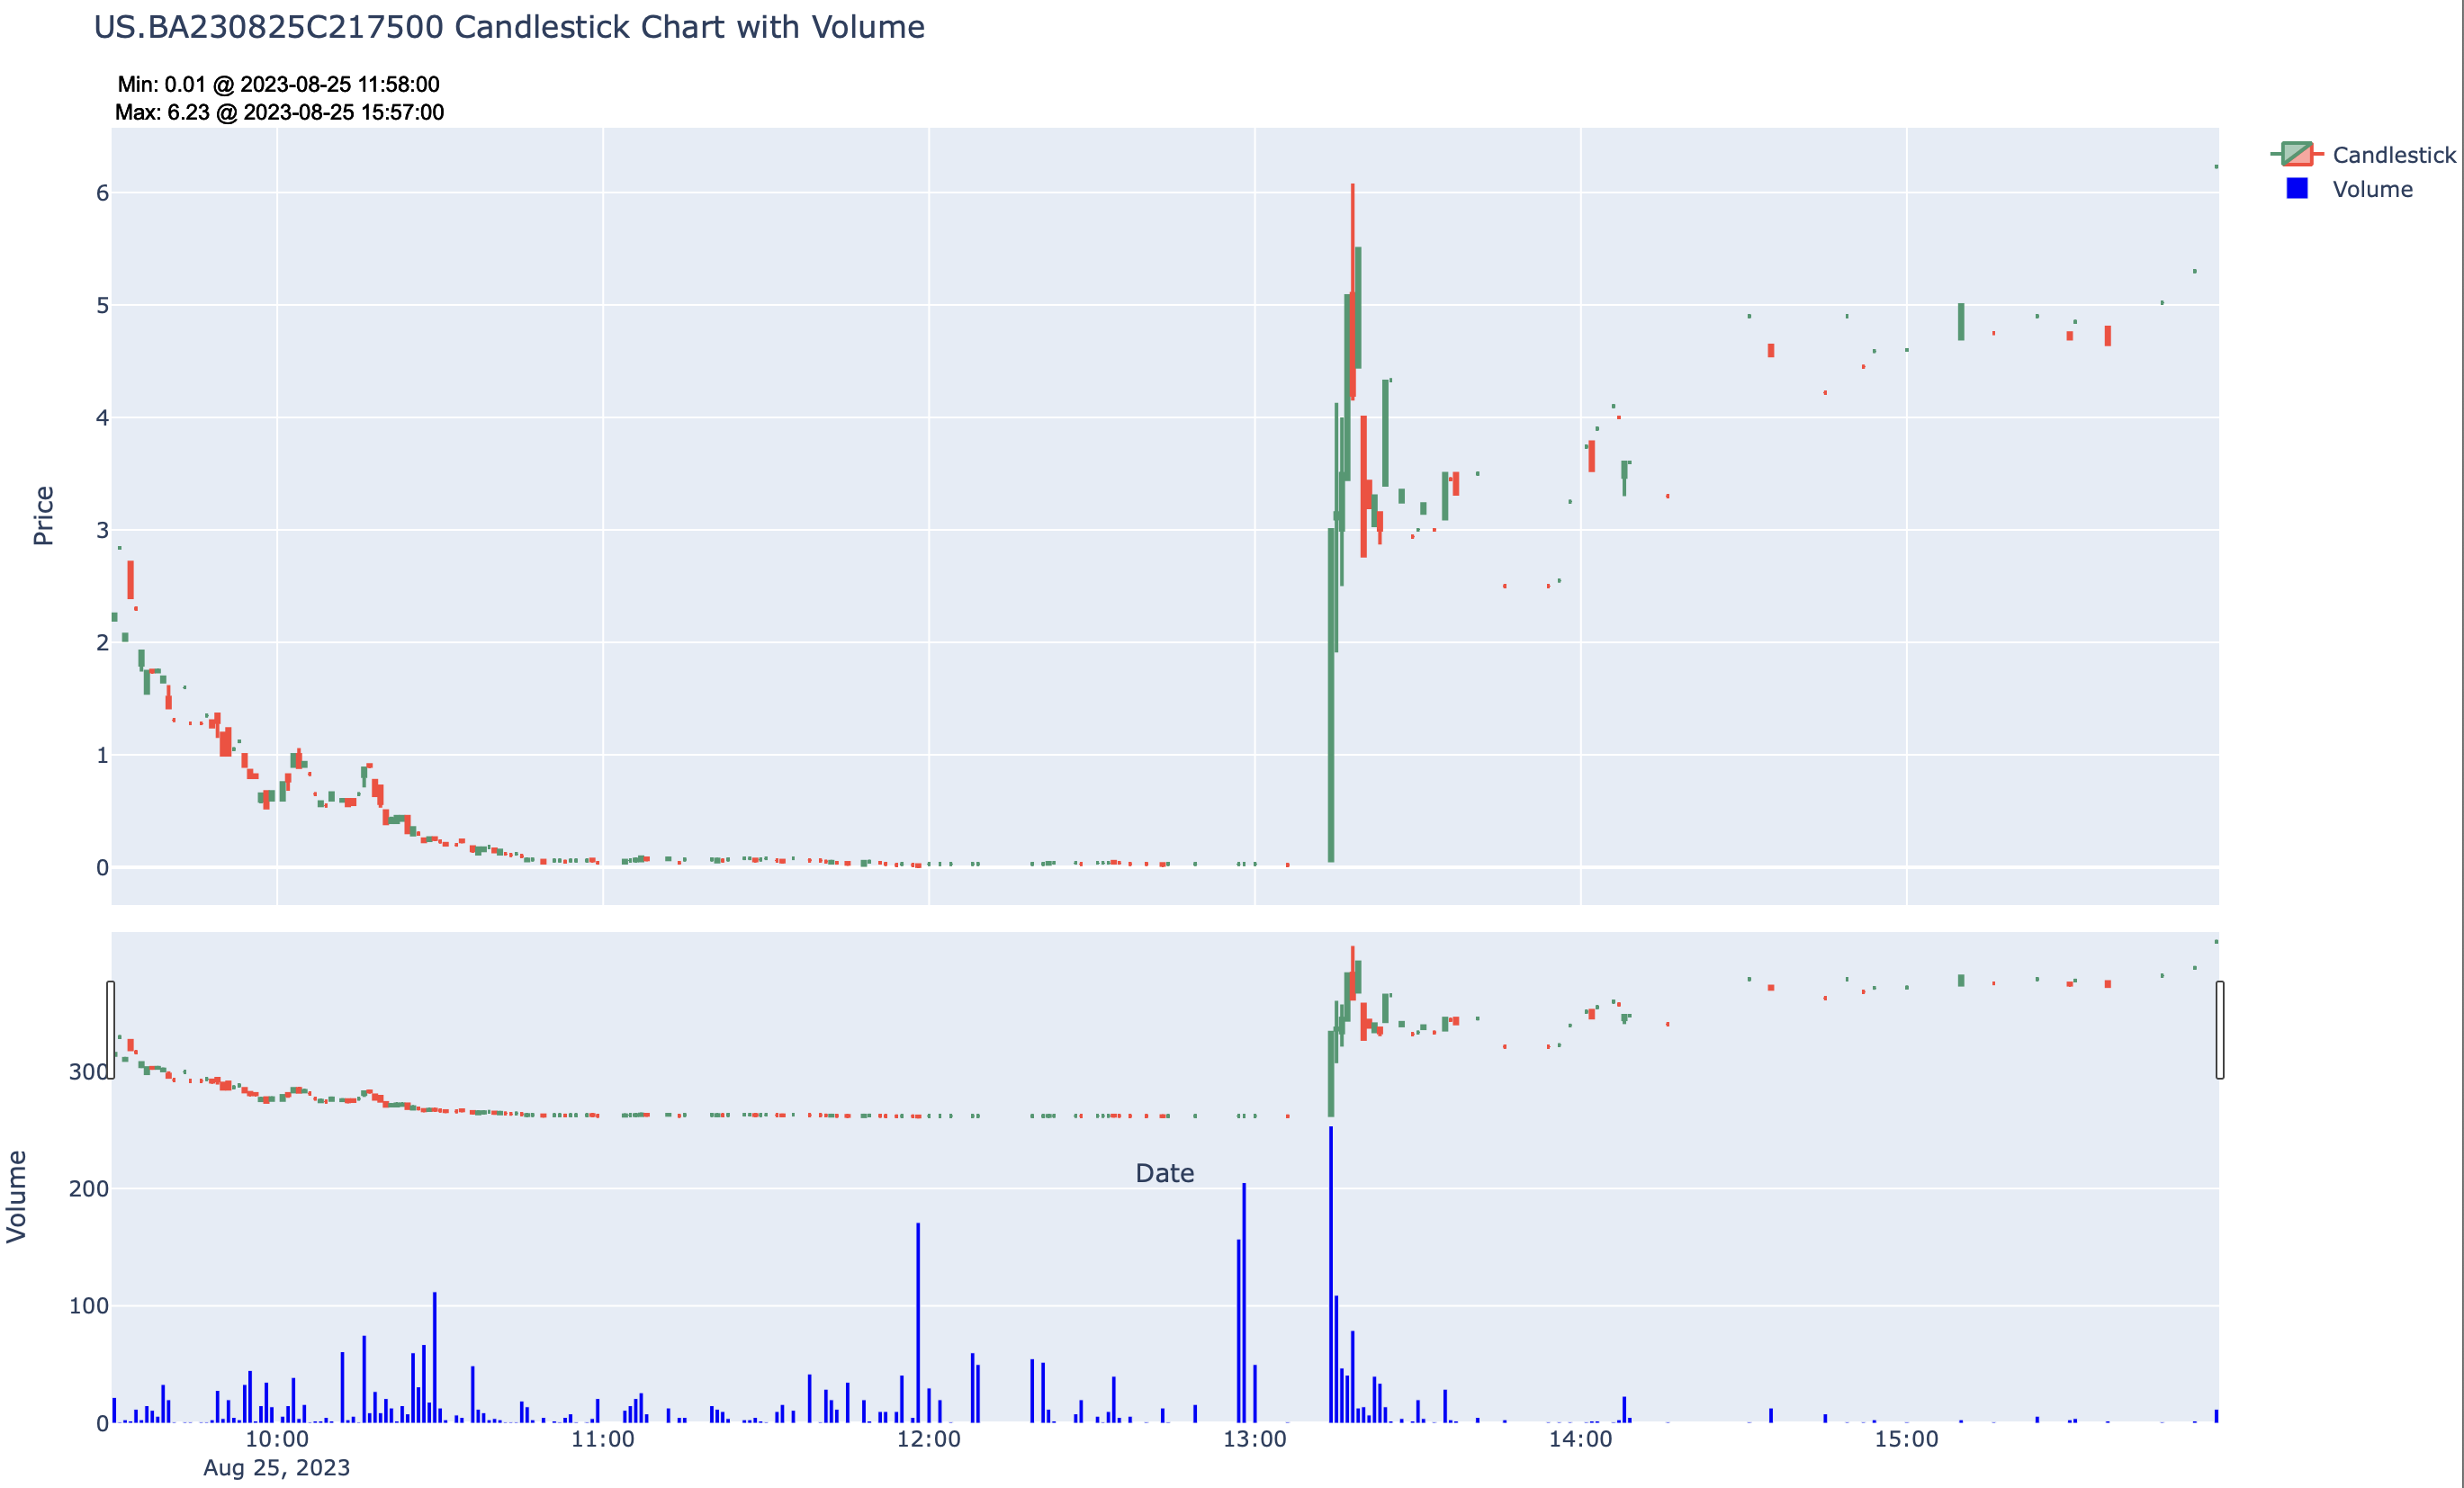
OHLC + volume 1-minute candlestick plot for US.BA230825C217500. Click on the image to open an interactive chart.
3. US.COST230526C505000
- Contract: $505 0DTE call option on COST (Costco Wholesale Corporation)
- Expiry Date: May 26, 2023
- Entry: Bid/ask of 0.01/0.02 at 09:38 AM, May 26, 2023
- Exit: Bid/ask surged to 4.8/5.25 at 2:44 PM, May 26, 2023
- % Gain: Approximately 23900% gain over 5 hours and 5 minutes.
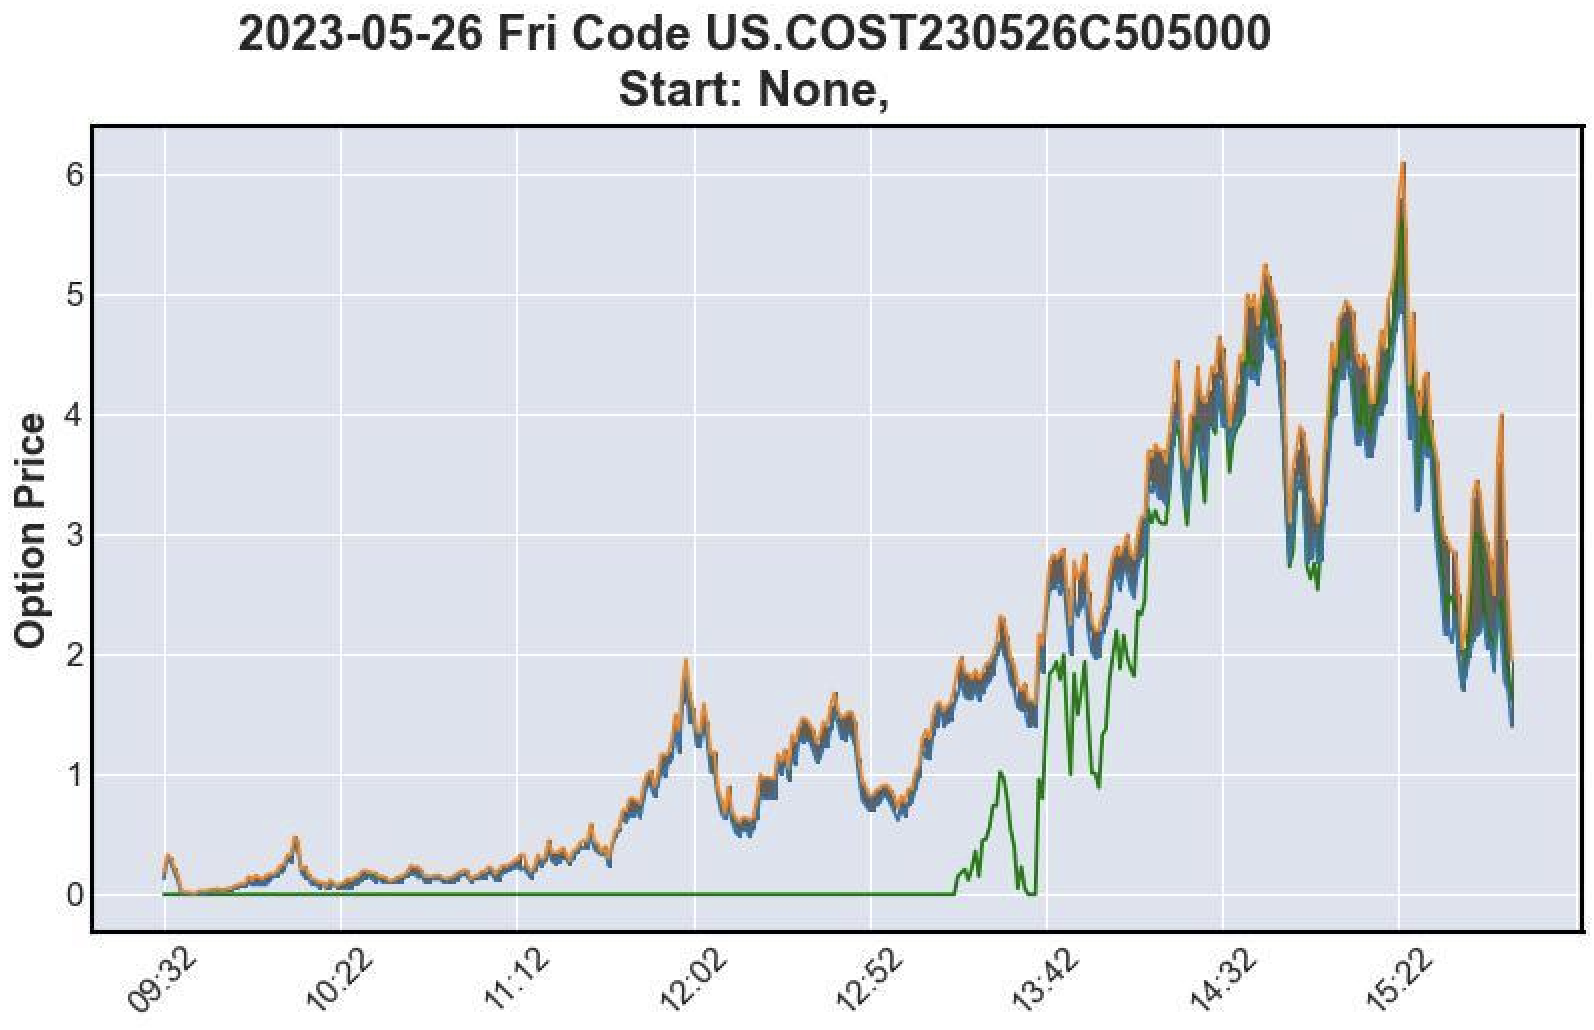
Bid/ask plot for US.COST230526C505000
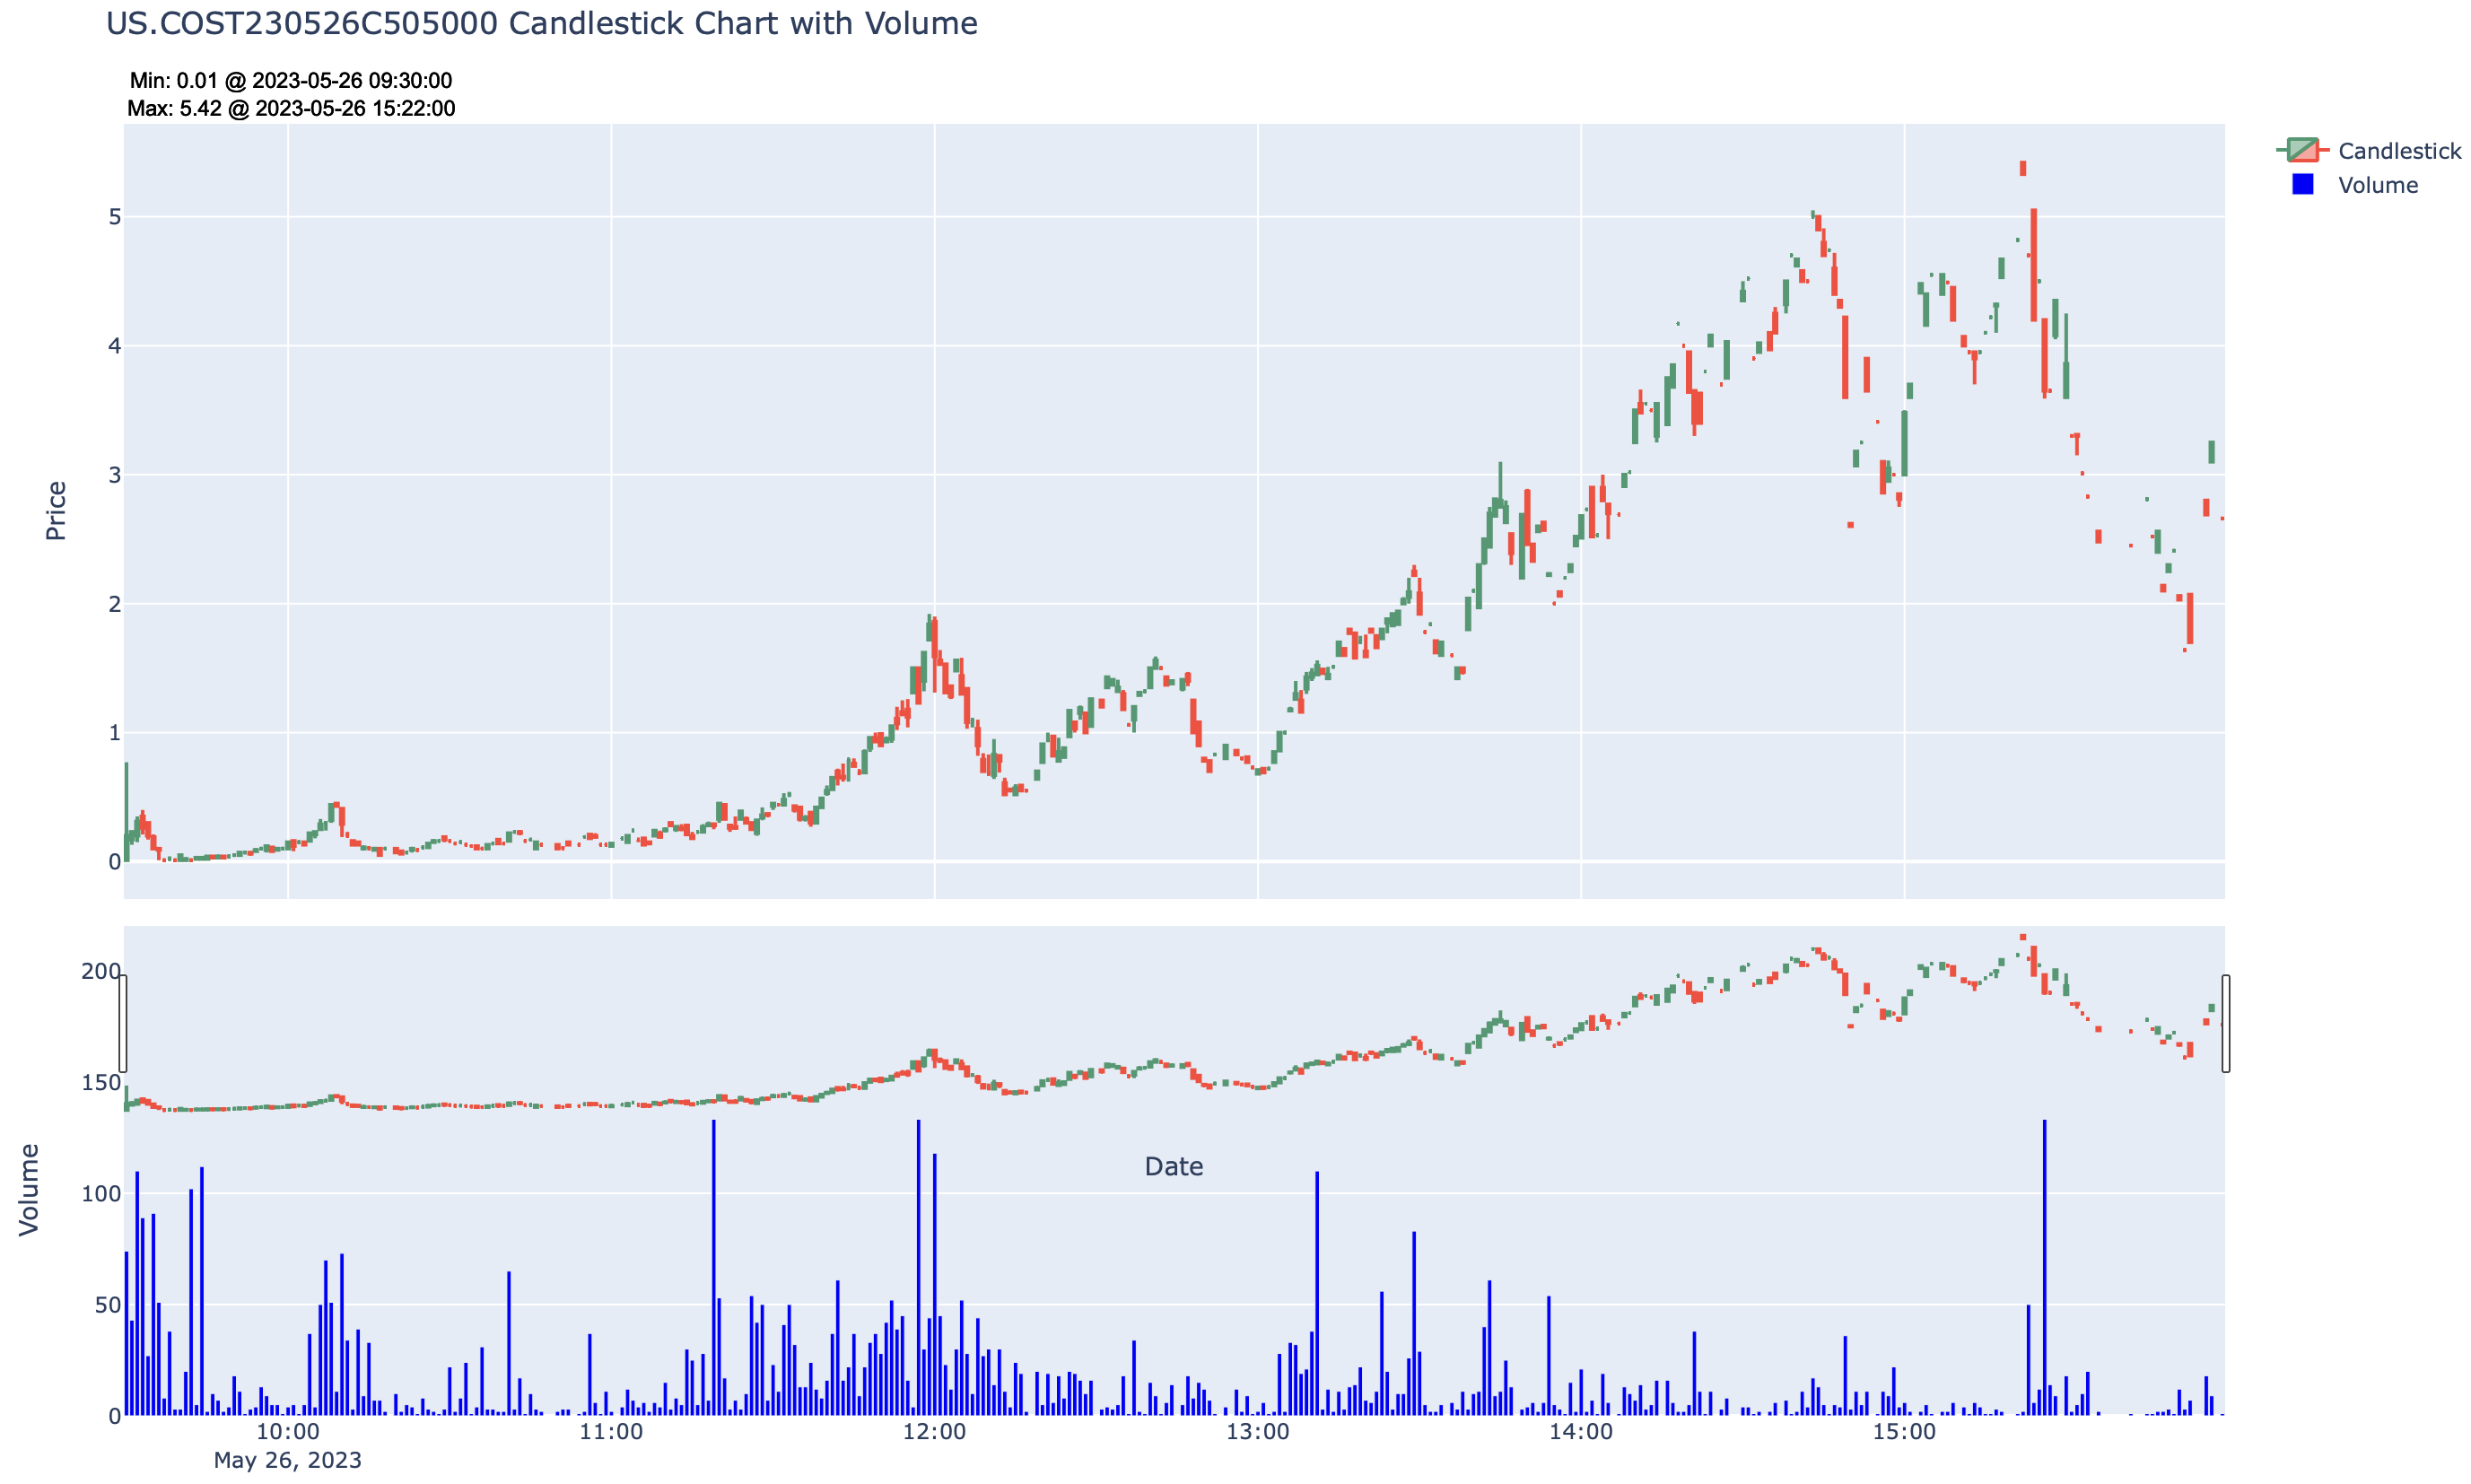
OHLC + volume 1-minute candlestick plot for US.COST230526C505000. Click on the image to open an interactive chart.
4. US.PDD240223P130000
- Contract: $130 0DTE put option on PDD (PDD Holdings Inc - ADR)
- Expiry Date: February 23, 2024
- Entry: Bid/ask of 0.02/0.04 at 11:52 AM, February 23, 2024
- Exit: Bid/ask surged to 5.05/5.65 at 2:31 PM, February 23, 2024
- % Gain: Approximately 12500% gain over 2 hours and 39 minutes.
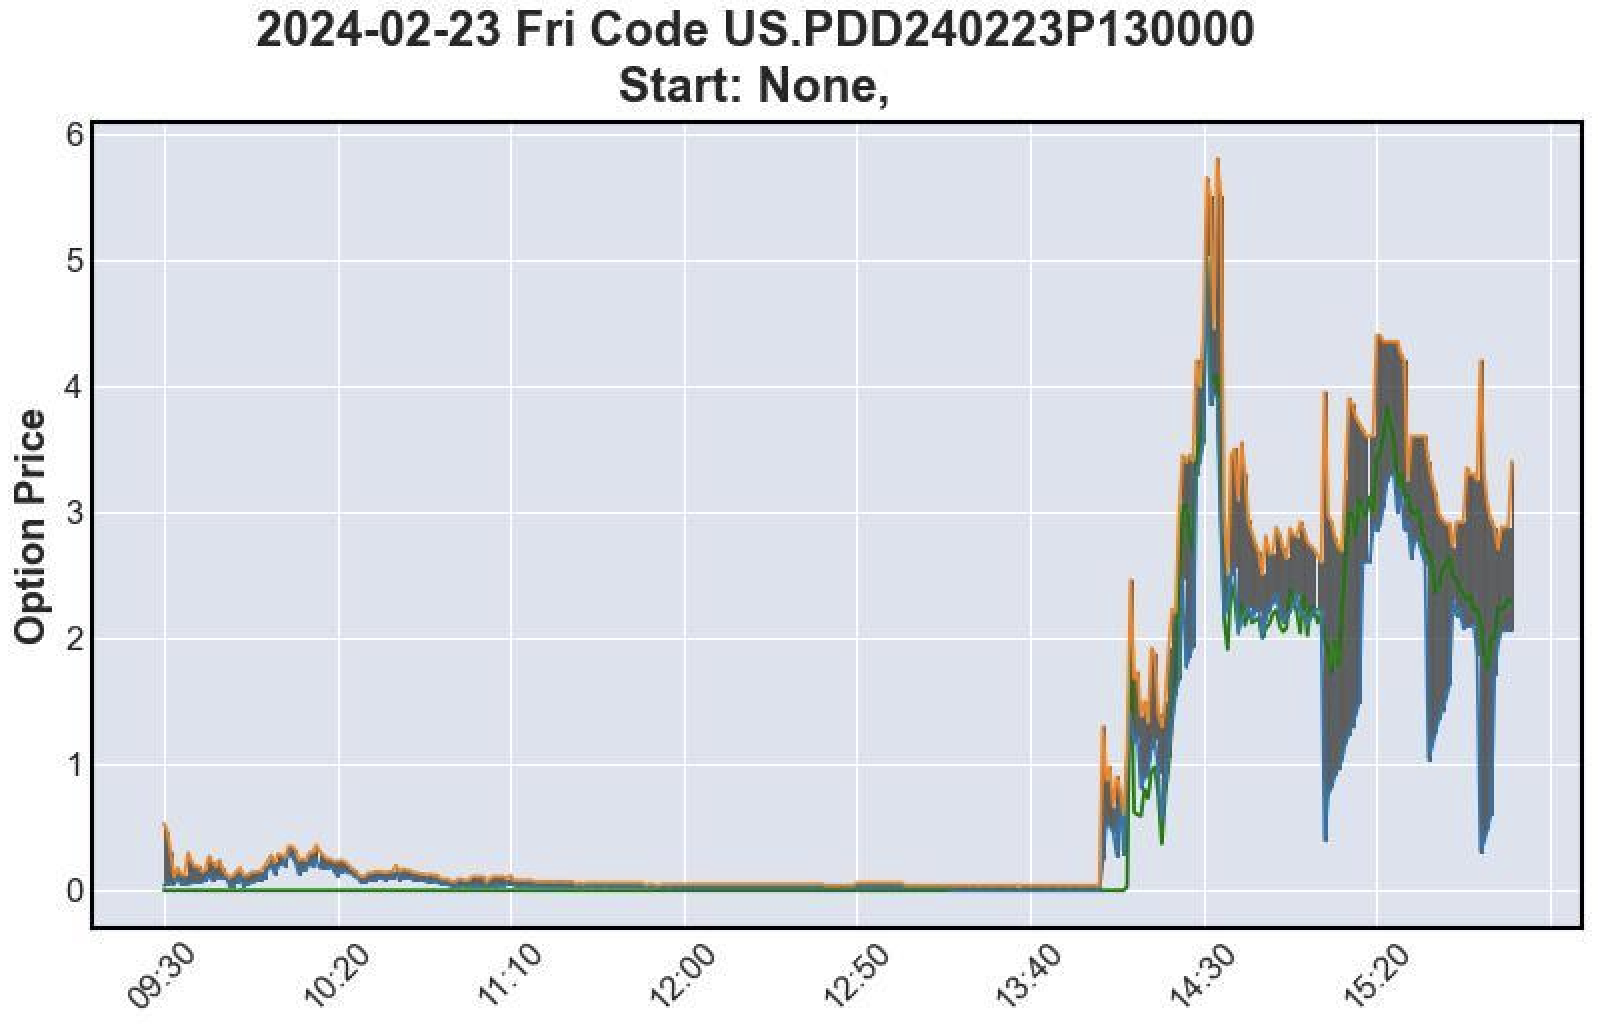
Bid/ask plot for US.PDD240223P130000
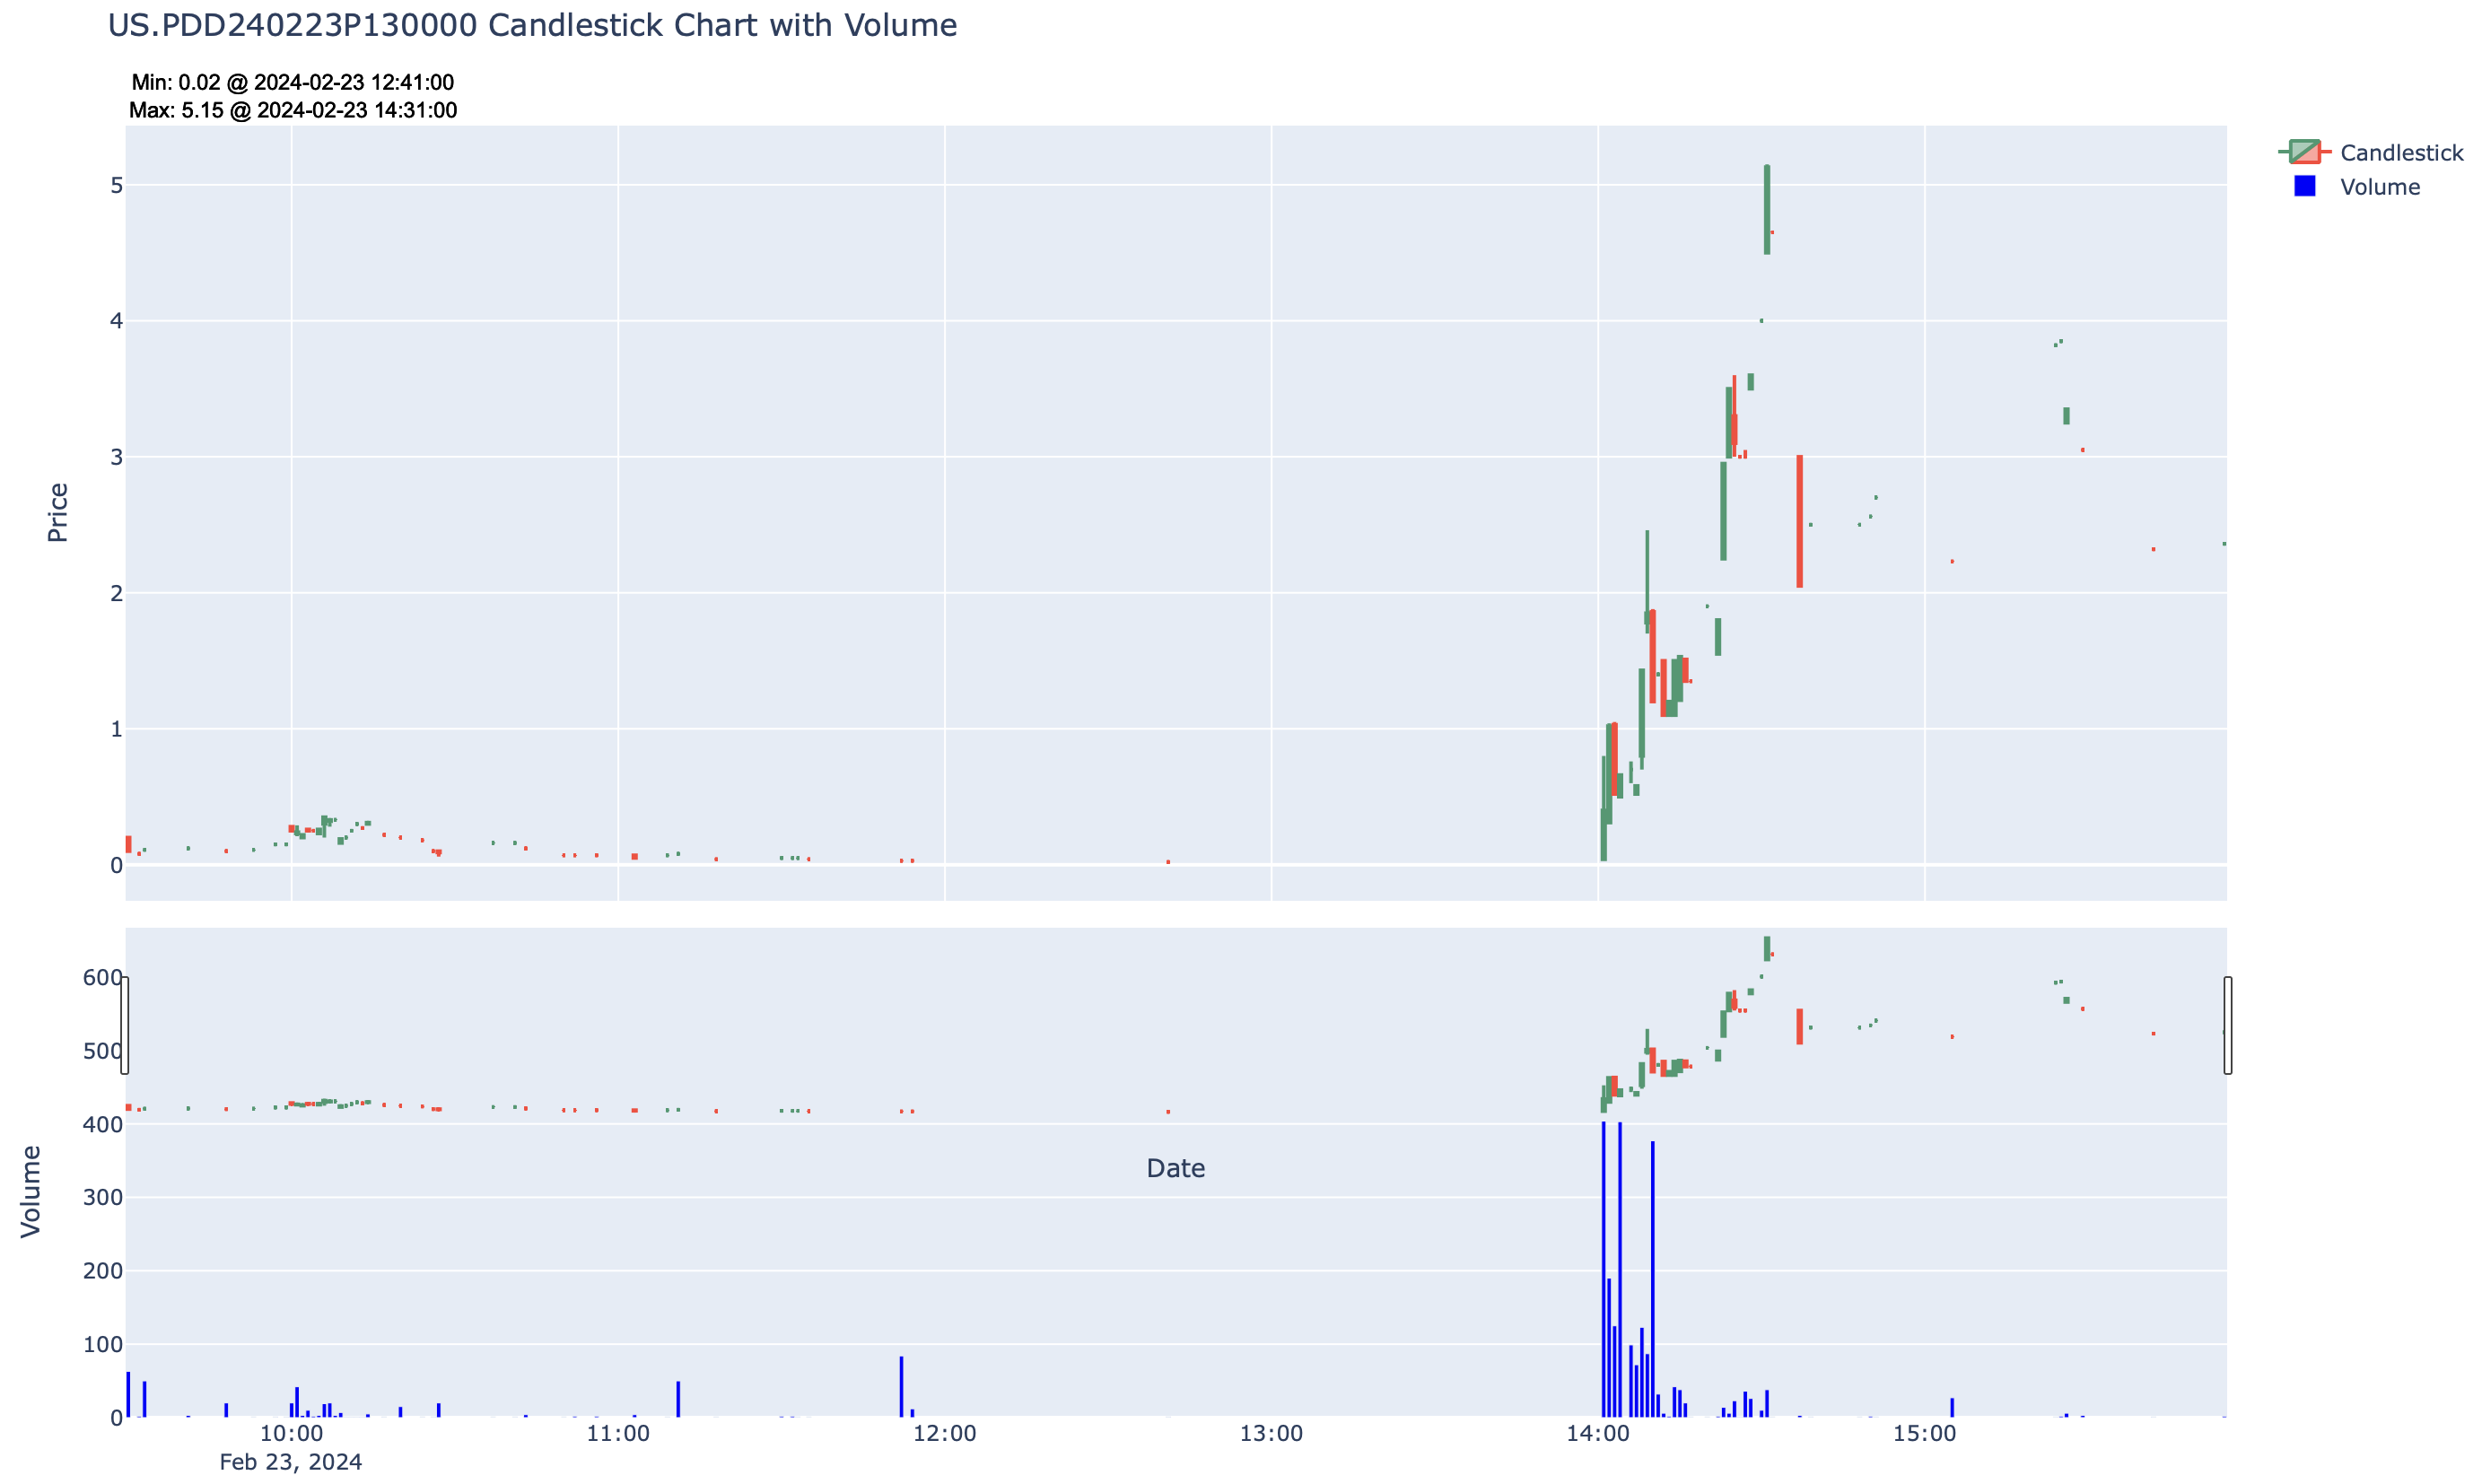
OHLC + volume 1-minute candlestick plot for US.PDD240223P130000. Click on the image to open an interactive chart.
Understanding the Greeks
In addition to understanding the potential gains and risks of options trading, my mentor introduced me to the concept of "the Greeks." These are parameters used to measure the sensitivity of an option's price to changes in various factors, such as underlying price, volatility, time decay, and interest rates.
Key Greeks to Know:
- Delta: Measures the rate of change of the option price with respect to changes in the underlying asset's price. A delta of 0.5 means the option price will change by $0.50 for every $1 change in the underlying stock price.
- Gamma: Indicates the rate of change of an option's delta relative to changes in the underlying asset's price. It measures the convexity of the option price.
- Theta: Represents the rate of decline in the option price with the passage of time. It measures the option's time decay.
- Vega: Measures the sensitivity of the option price to changes in implied volatility. Higher vega values indicate greater sensitivity to changes in volatility.
Emphasizing Rarity and Risk
The examples provided illustrate the extraordinary profit potential of options trading, but it's crucial to understand the inherent risks, particularly for option sellers. While option buyers can potentially achieve significant gains within short timeframes, they also face the risk of losing their entire investment if the market doesn't move in their favor.
On the other hand, option sellers, while enjoying a high win rate under normal market conditions, face the risk of substantial losses when confronted with rare but impactful events, such as the ones highlighted in these examples. These events can lead to rapid and extreme price movements, causing substantial losses for option sellers who may be caught on the wrong side of the trade.
Pros and Cons:
Option Buyers:
- Pros: Potential for unlimited gains, limited risk (premium paid), flexibility in trading strategies.
- Cons: High probability of losing entire premium, time decay erodes value of options over time.
Option Sellers:
- Pros: High probability of success under normal market conditions, option premium collected acts as income.
- Cons: Unlimited risk, potential for catastrophic losses during extreme market events, obligation to fulfill contract terms.
Conclusion
My journey into day trading options was ignited by the guidance of a mentor who skillfully showcased the transformative potential of options through real-life examples. The experience not only broadened my understanding of trading strategies but also fueled my enthusiasm to explore and master the art of day trading options further.
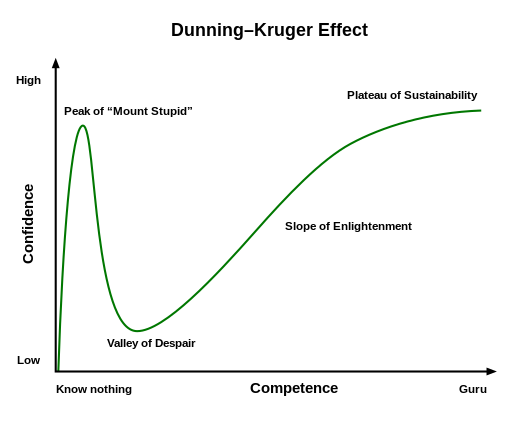
I didn't know it then, but my newfound knowledge had placed me at the peak of "Mount Stupid"...
However, as I delved deeper into the world of options, I quickly realized that my newfound knowledge had placed me at the peak of the "Mount Stupid" on the Dunning-Kruger effect curve. Despite my eagerness to learn, I had yet to gain real-world experience and fully comprehend the complexities and risks associated with options trading. Nevertheless, this realization marked the beginning of another chapter in my trading journey—one filled with valuable lessons, challenges, and growth opportunities. But that, as they say, is a story for another day.